All programs have to continuously prove themselves as they prototype, implement, expand, and go to scale. Complex care programs often have a lot of stakeholders: senior leaders, payers or other funders, primary care providers, and the field of complex care, among others.
Storyboards that include run charts are useful in keeping stakeholders engaged in the program’s results and demonstrating the program’s commitment to data and improvement. They’re also useful in keeping the program team focused on learning.
The goal of this play is to help you implement your model, iterate, sustain, and learn.
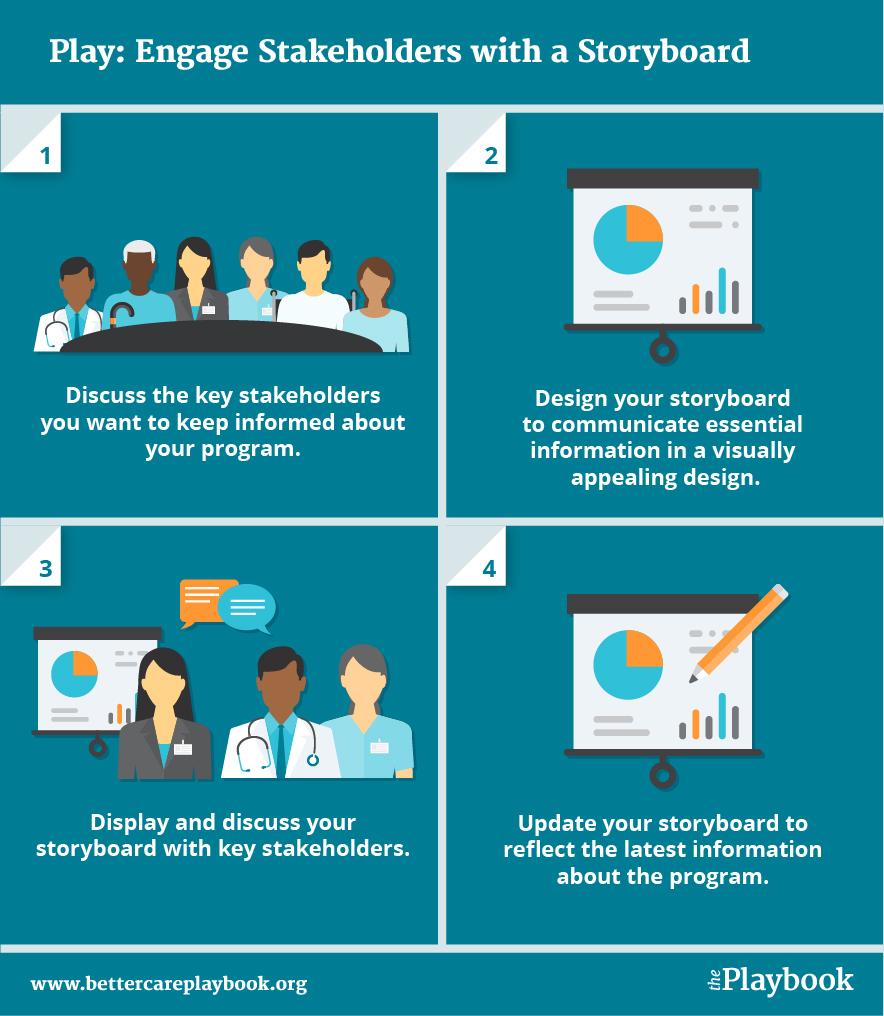
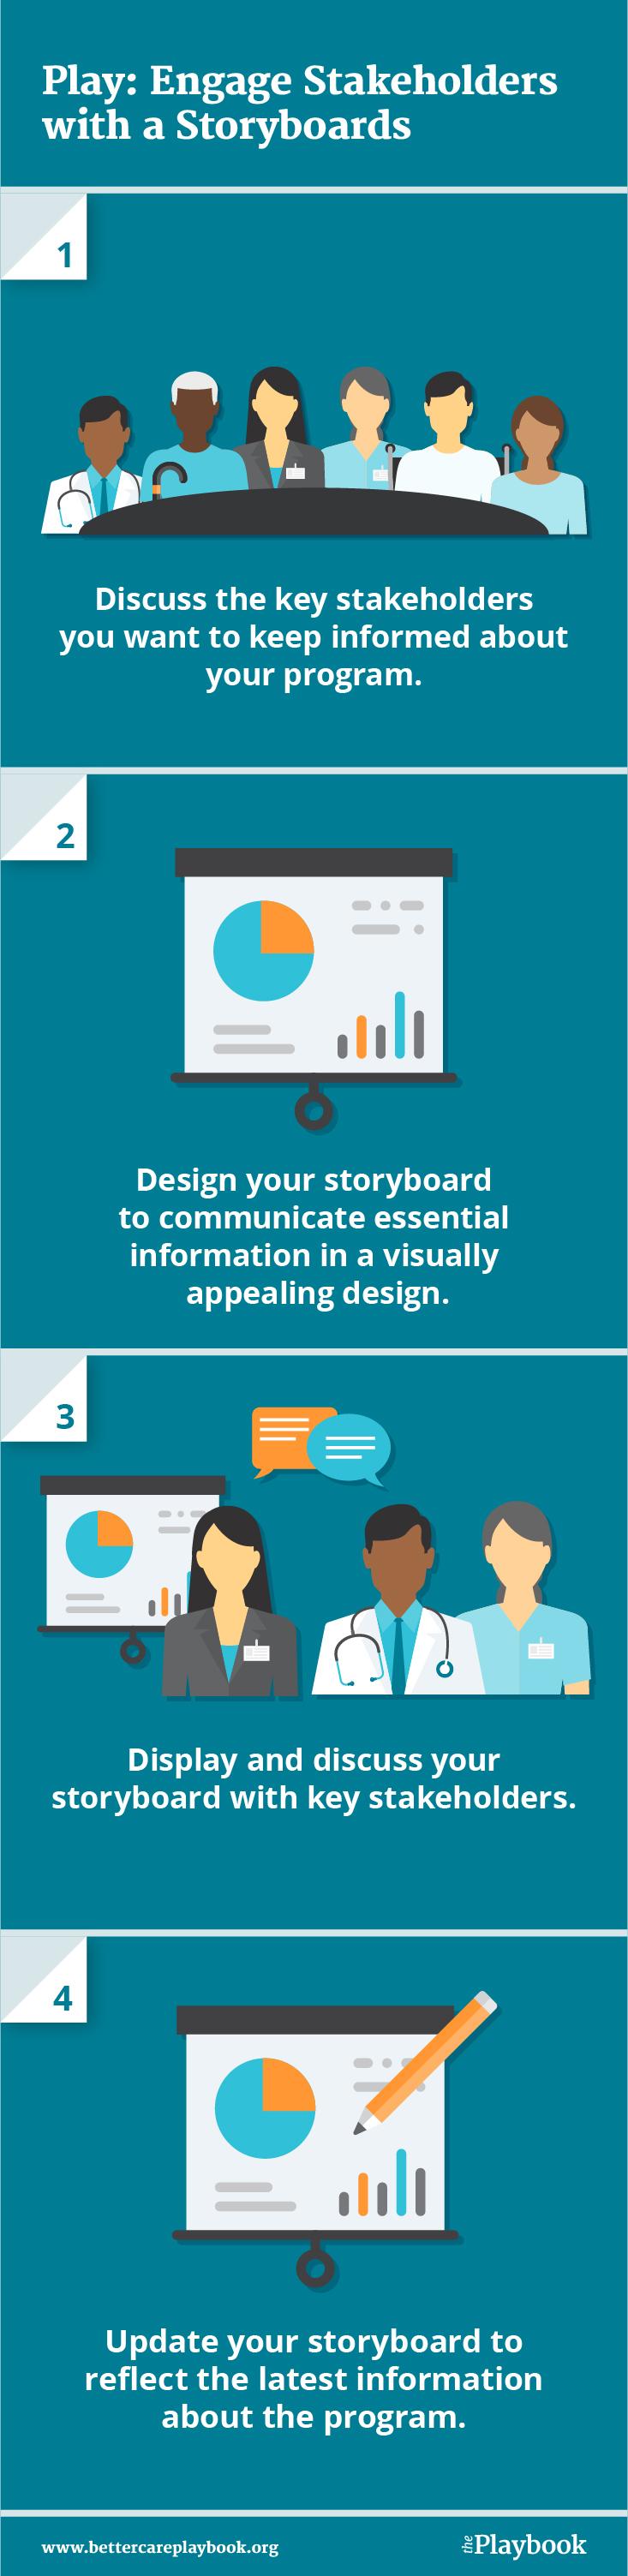
- Discuss the key stakeholders you want to keep informed about your program.
- Design your storyboard to communicate essential information in a visually appealing design.
- Display and discuss your storyboard with key stakeholders.
- Update your storyboard to reflect the latest information about the program.
- It’s important to make your storyboard attractive and simple. Your goal is to draw people in to learning more about your program, not to create an exhaustive description of your work.
- Consider also creating a version of your storyboard as a slide or set of slides. The same principles apply – make it visually appealing, keep it simple, and share your data. A set of slides gives you more flexibility to tailor your presentation to the interests of your audience.
- You can share your storyboard at meetings, conferences, and near your work space. For example, you may want to display your storyboard near your program team’s office or in the shared space of the clinical team managing the patient panel. This can help foster a culture of learning from data to improve.
- Displaying data over time in a run chart is an ideal way to show the variation inherent in a process and to show improvement. Complex charts or tables can diminish the viewer’s ability to understand your work at a glance.
- Consider listing your aim statement, key measures, results, and changes being tested. It’s okay for your metrics to change over time as you program develops and your team learns. Be sure to document what you’ve learned and changed on your storyboard, and make sure your run chart reflects your current metrics.
- Make sure to include some forward-looking information on your storyboard. For example, you can include your conclusions about what you have learned from your results so far and plans for further testing or changes to the program.
For More Information
- Download the storyboard tool and the run chart tool from the Institute for Healthcare Improvement.
- View an example storyboard (presented through slides) from the Winnipeg Regional Health Authority.
- To learn more about key stakeholders in complex care programs, visit these resources on the Better Care Playbook:
- To learn more about sustaining performance through program management, visit these resources on the Better Care Playbook:
This play was developed by the Institute for Healthcare Improvement (IHI) as a tool for effectively presenting a team’s work to a variety of audiences and stakeholders.